Initiating Coverage | Cable
December 30, 2016
KEI Industries
BUY
CMP
`124
Wiring for growth
Target Price
`153
KEI Industries (KEI) is a cable manufacturing company and also engaged in
Investment Period
12 Months
Engineering, Procurement and Construction (EPC) business. It offers high and low
tension cables, control and instrumentation cables, house wires, stainless steel
Stock Info
wires, and high-technology specialty cables. Its manufacturing facilities are
located at Bhiwadi, Chopanki & Silvassa. Through export KEI is present in over 45
Sector
Cable
countries across the globe.
Market Cap (` cr)
969
Healthy order book indicates strong revenue visibility: KEI’s current order book
Net Debt (` cr)
492
stands at `3,233cr (`2,154cr from EPC segment, `667cr from Cable segment,
Beta
1.2
`200cr from EHV segment, `49cr from Substation and the balance from EPC L1
52 Week High / Low
140/86
business). Its order book grew by ~28% in the last 3 years on the back of order
Avg. Daily Volume
113,885
inflows from State Electricity Boards, Power grid, etc. This gives KEI, a revenue
visibility for the next 12-16 months.
Face Value (`)
2
BSE Sensex
26,366
Strengthening distribution network and higher ad Spend to increase B2C
business: KEI’s consistent effort to increase its retail business from 30% of revenue
Nifty
8,104
in FY16 to 40-45% of revenue in the next 2-3 years on the back of strengthening
Reuters Code
KEIN.BO
distribution network (currently 926 which is expect to increase 1500 by FY19) and
Bloomberg Code
KEII.IN
higher ad spend (increased from `2cr in FY13 to `7cr in FY16 and expected to spend).
Exports to continue its growth momentum: KEI’s exports (8% of revenue in FY16)
is expected to reach a level of ~14-15% in next two years on the back of higher
Shareholding Pattern (%)
order execution from current order book of ~`180cr and participation in various
Promoters
49.0
international tenders worth `500cr. We expect a strong ~26% growth CAGR over
MF / Banks / Indian Fls
18.6
FY2016-19 in exports.
FII / NRIs / OCBs
5.8
Interest cost as % of net sales to decline by 150bp over FY16-19: We expect the
Indian Public / Others
26.6
company’s interest cost to decline due to (1) full repayment of its `211cr term
loan in next 2-3 years and (2) marginally lower interest cost arising due to the
improvement in credit rating. While company may see some rise in its working
Abs.(%)
3m
1yr
3yr
capital requirement due to higher sales in EPC segment, the debt repayment and
low interest rate should offset the same. Due to this, we expect interest cost to
Sensex
(7.4)
0.7
24.0
decline as % of sales which will further result in better profitability.
KEI
4.1
4.1
958.4
Outlook and Valuation: We expect KEI to report net revenue CAGR of ~13% to
~`3,335cr over FY2016-19E mainly due to (a) higher order book execution in
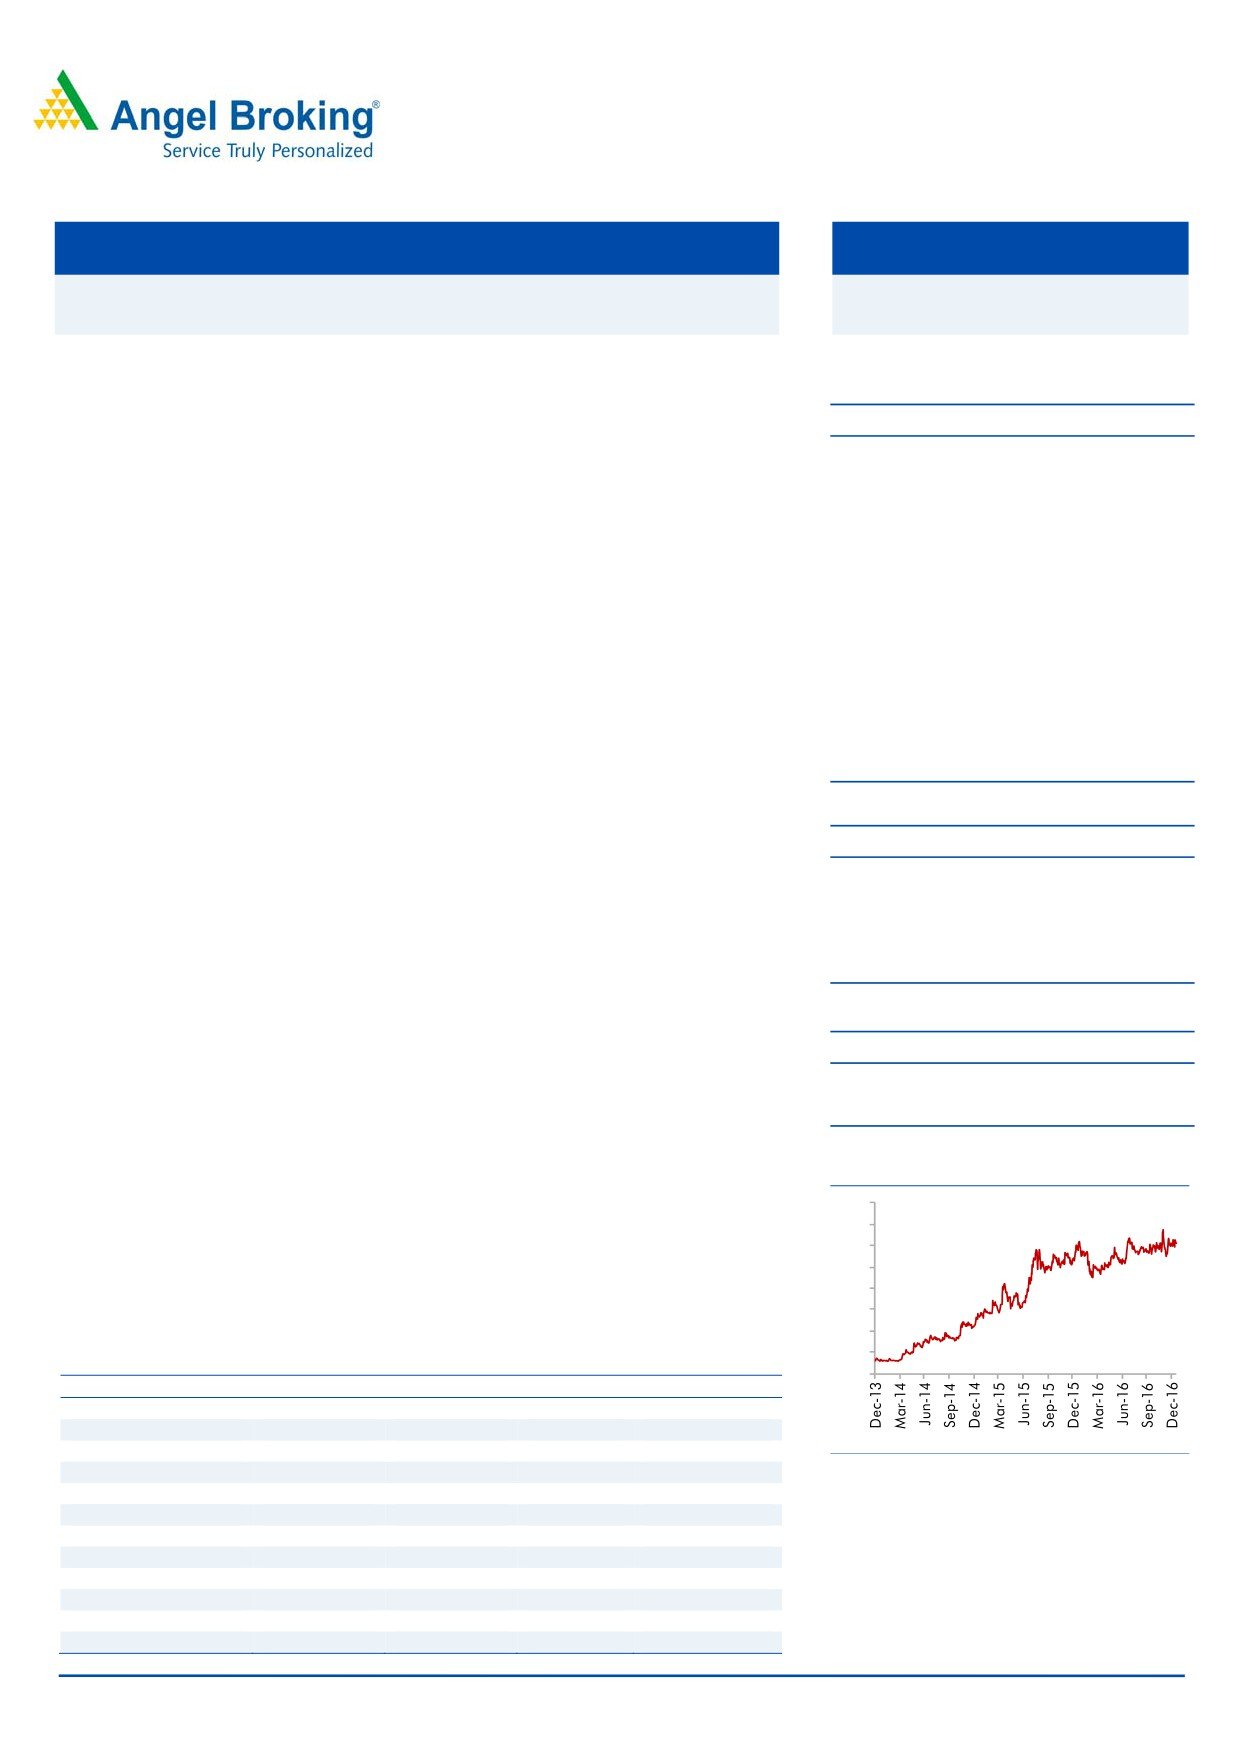
3-year price chart
EPC segment (b) growth in EHV business and (c) higher B2C sales and (d) higher
160
exports. On the bottom-line front, we expect a CAGR of ~24% to `118cr over the
140
same period on the back strong revenue and lower interest cost. At the CMP of
120
100
`124, the stock trades at 8.1x its FY2019E EPS of `15.3. We initiate coverage on
80
the stock with a Buy recommendation and target price of `153 based on 10x
60
FY2019E EPS, indicating an upside of ~23% from the current levels.
40
20
Key financials
0
Y/E March (` cr)
FY2016
FY2017E
FY2018E
FY2019E
Net sales
2,326
2,574
2,921
3,335
% chg
14.5
10.7
13.5
14.2
Net profit
62
78
91
118
Source: Company, Angel Research
% chg
91.0
25.4
17.1
29.0
EBITDA margin (%)
10.4
10.4
10.0
10.0
EPS (`)
8.1
10.1
11.8
15.3
P/E (x)
15.4
12.3
10.5
8.1
P/BV (x)
2.6
2.2
1.8
1.5
RoE (%)
17.0
17.7
17.4
18.6
RoCE (%)
25.1
24.2
24.5
25.5
Amarjeet S Maurya
EV/Sales (x)
0.6
0.6
0.5
0.4
022-39357800 Ext: 6831
EV/EBITDA (x)
6.0
5.6
5.1
4.5
Source: Company, Angel Research, Note: CMP as of December 29, 2016
Please refer to important disclosures at the end of this report
1
KEI Industries | Initiating Coverage
Key investment arguments
Top-line expected to grow by ~13% CAGR over FY16-19E
We expect the company to report a healthy revenue growth of ~13% over
FY16-19E on the back (1) strong order book leading to higher execution in EPC
segment (2) Huge opportunity in EHV segment (3) higher growth in exports.
Healthy order book indicates strong revenue visibility
KEI’s current order book stands at `3,233cr (`2,154cr from EPC segment, `667cr
from Cable segment, `200cr from EHV segment, `49cr from Substation and the
balance from EPC L1 business). Its order book grew by ~28% in the last 3 years
on the back of order inflows from State Electricity Boards, Power grid, etc. This
gives a revenue visibility for the next 12-16 months.
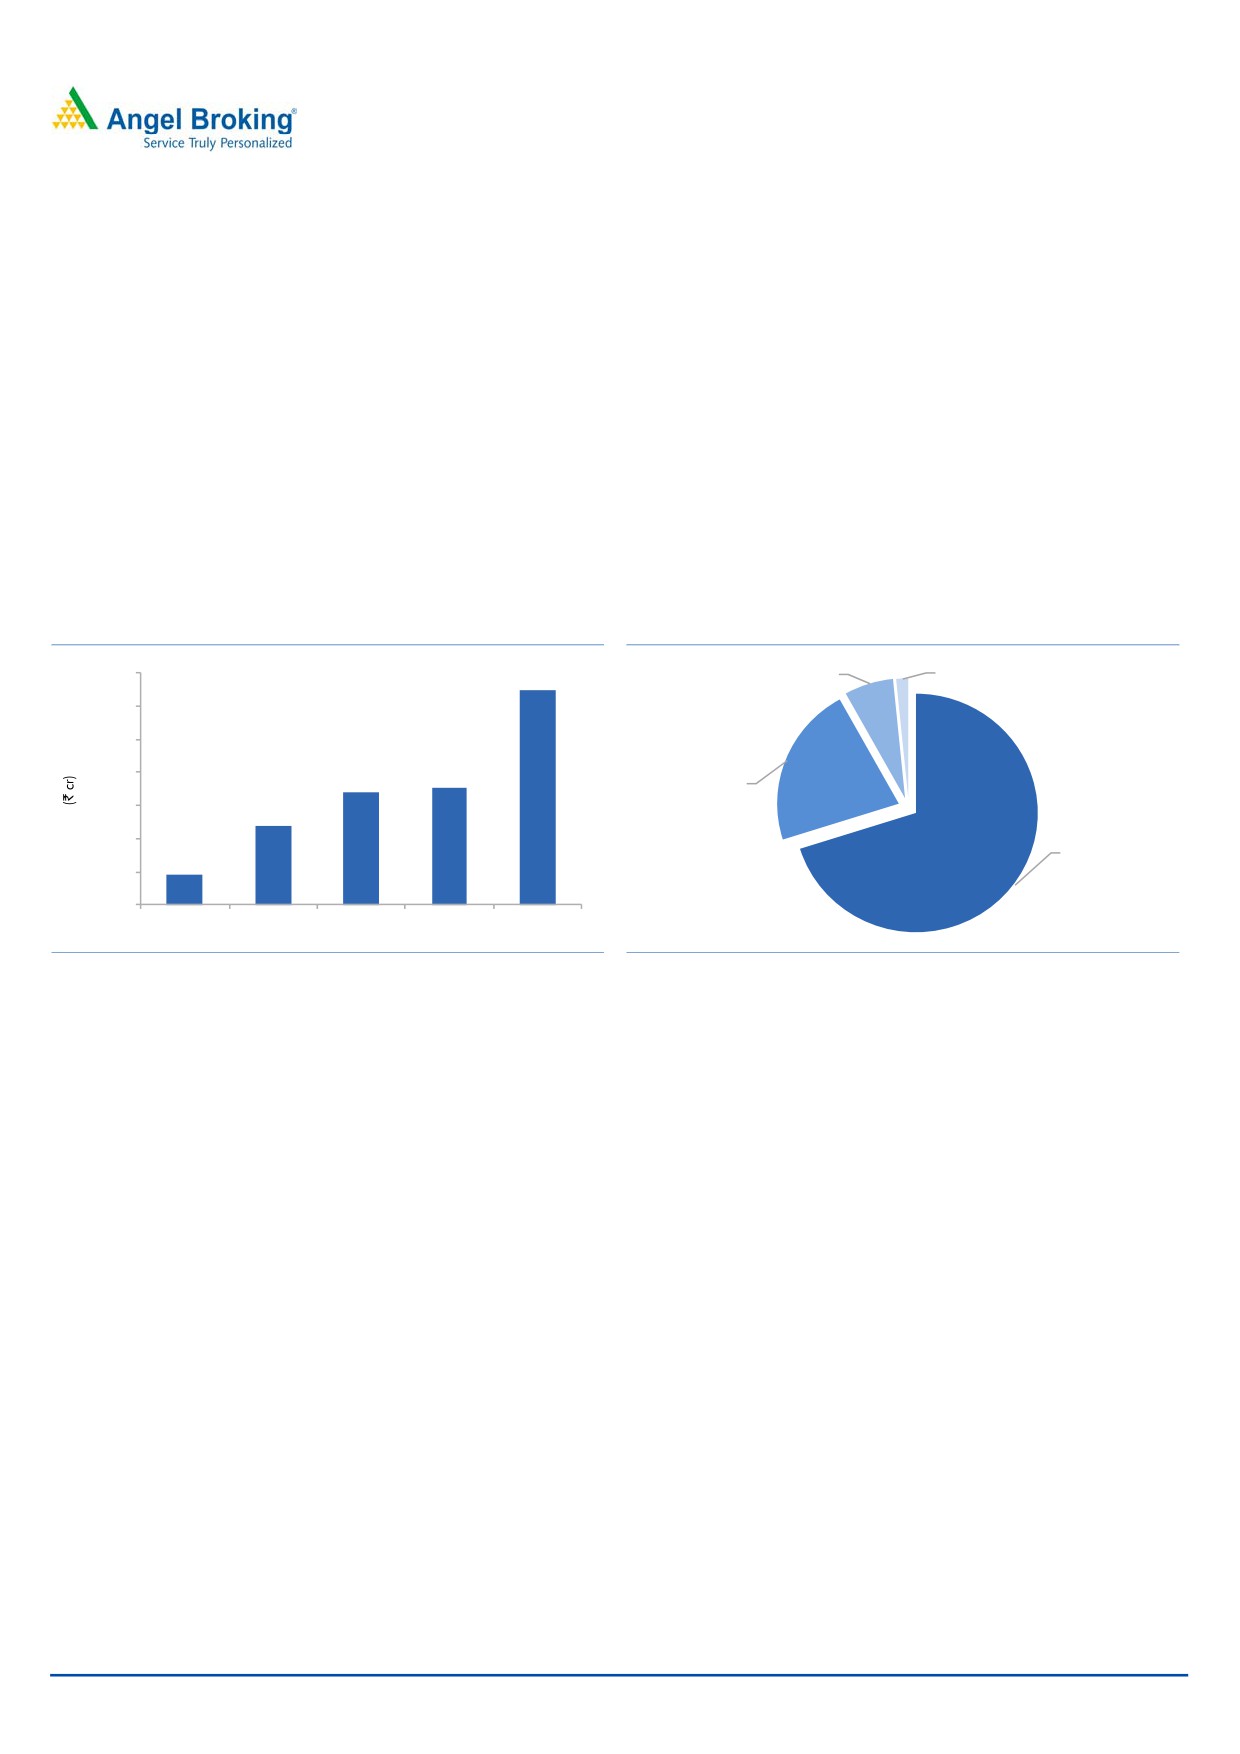
Exhibit 1: Oder book increased 1.8x from last year
Exhibit 2: Break-up of current order book
EHV, 6.5%
Substation,
3,500
3,233
1.6%
3,000
2,500
2,000
1,700
1,760
Cable, 21.7%
1,500
1,200
1,000
EPC, 70.2%
460
500
0
FY13
FY14
FY15
FY16
Current
Source: Company, Angel Research
Source: Company, Angel Research
Higher growth in EPC to boost the strong revenue growth
In the EPC segment, the main services offered by the company in the EPC segment
include execution of (1) Power transmission projects of 66kV to 400kV substations
on turnkey basis (2) EPC of EHV & HV cables systems (3) Electrical balance of plant
system for power plant (4) Electrical industrial projects etc.
KEI’s track record in key project execution is as below
EPC of HV Cablings system for JVVNL, Jaipur
MES for 100kV Transform and Electrical System of Air Force station, Gurgaon
Projects for power transmission utilities including projects for MSETCL, KSEB,
TNEB, RVPNL
Projects for Reliance Infrastructure (400kV switchyard for 2x600 mw Thermal
Power Project at Hissar
Industrial sector for AERENR, Ludhiana
Private utilities like Reliance, Tata Etc
Going forward, we expect that the company would report ~26% CAGR in EPC
revenue on back of higher order book execution. Currently the company’s order
December 30, 2016
2
KEI Industries | Initiating Coverage
book stands at ~`2,154cr which includes order inflow from the distribution
companies from UP.
The company has backward integration in terms of in-house cable manufacturing;
this provides KEI with an edge over its competitors as 25-30% of the total EPC
order cost goes in cables. KEI’s backward integration insulates its EBITDA margin
(10-11%) and we believe that this will sustain going forward.
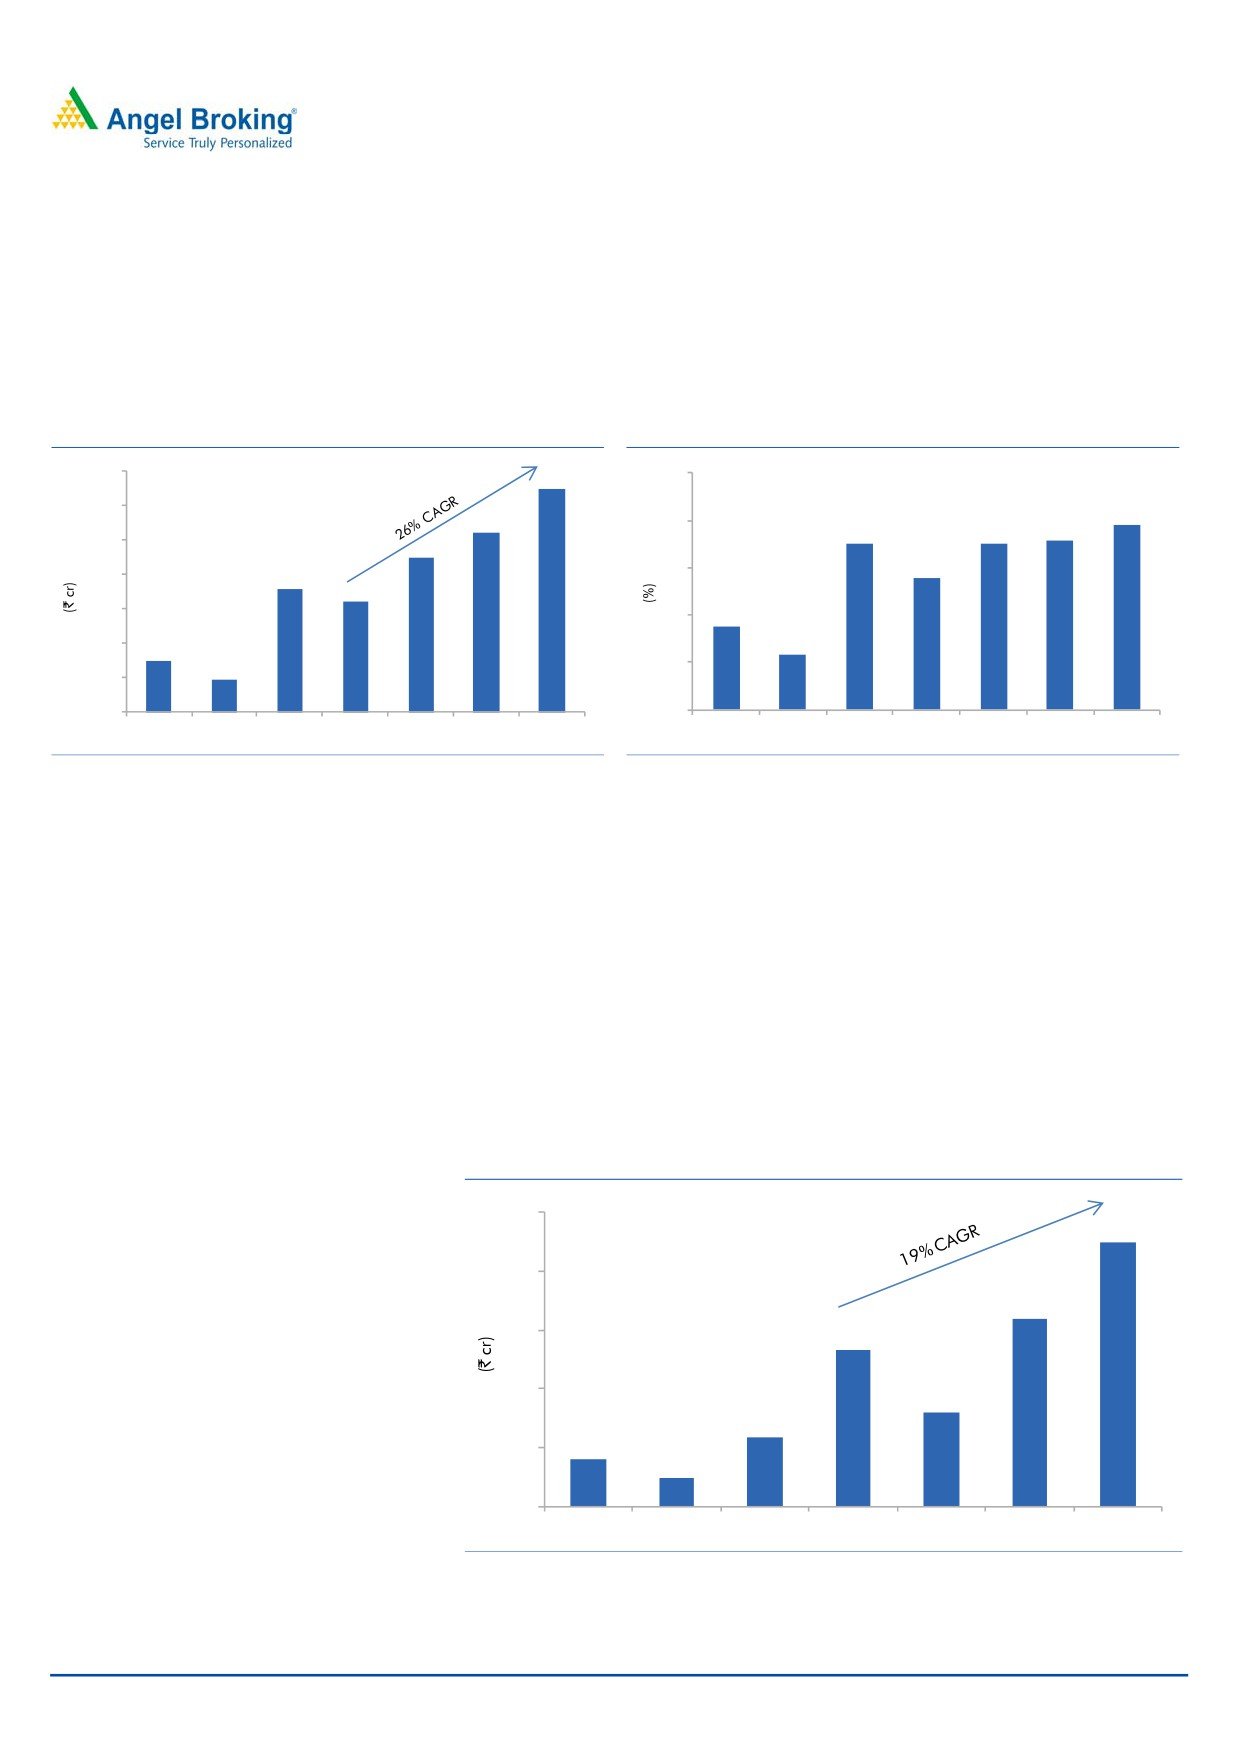
Exhibit 3: Strong growth expected in EPC segment
Exhibit 4: Revenue share of EPC business
700
25
600
19.5
20
17.8
17.6
17.5
500
13.9
15
400
8.9
300
10
5.8
200
5
100
0
0
FY2013
FY2014
FY2015
FY2016
FY2017E FY2018E FY2019E
FY2013
FY2014
FY2015
FY2016
FY2017E FY2018E FY2019E
Source: Company, Angel Research
Source: Company, Angel Research
Capacity expansion of EHV (Extra High Voltage) cable segment
to boost growth
KEI currently has an EHV cable manufacturing capacity of 700km ranging from
66kV upto 220kV for which it has a technical collaboration with Brugg Kabel AG,
Switzerland. To further increase its capacity in higher range, it has completed
`85cr capex, this includes manufacturing of EHV cables (upto 400KV) for 500km
capacity. The new capacity is expected to be operational by December-2016 and
has a potential to generate revenue of `250cr per annum. The company’s current
order book stands at `200cr. We expect EHV segment to report a CAGR of ~19%
over FY2016-FY2019E to `224cr.
Exhibit 5: Capacity expansion to fuel EHV segment growth
250
224
200
160
150
133
100
80
59
39
50
24
0
FY2013
FY2014
FY2015
FY2016
FY2017E FY2018E FY2019E
Source: Company, Angel Research
December 30, 2016
3
KEI Industries | Initiating Coverage
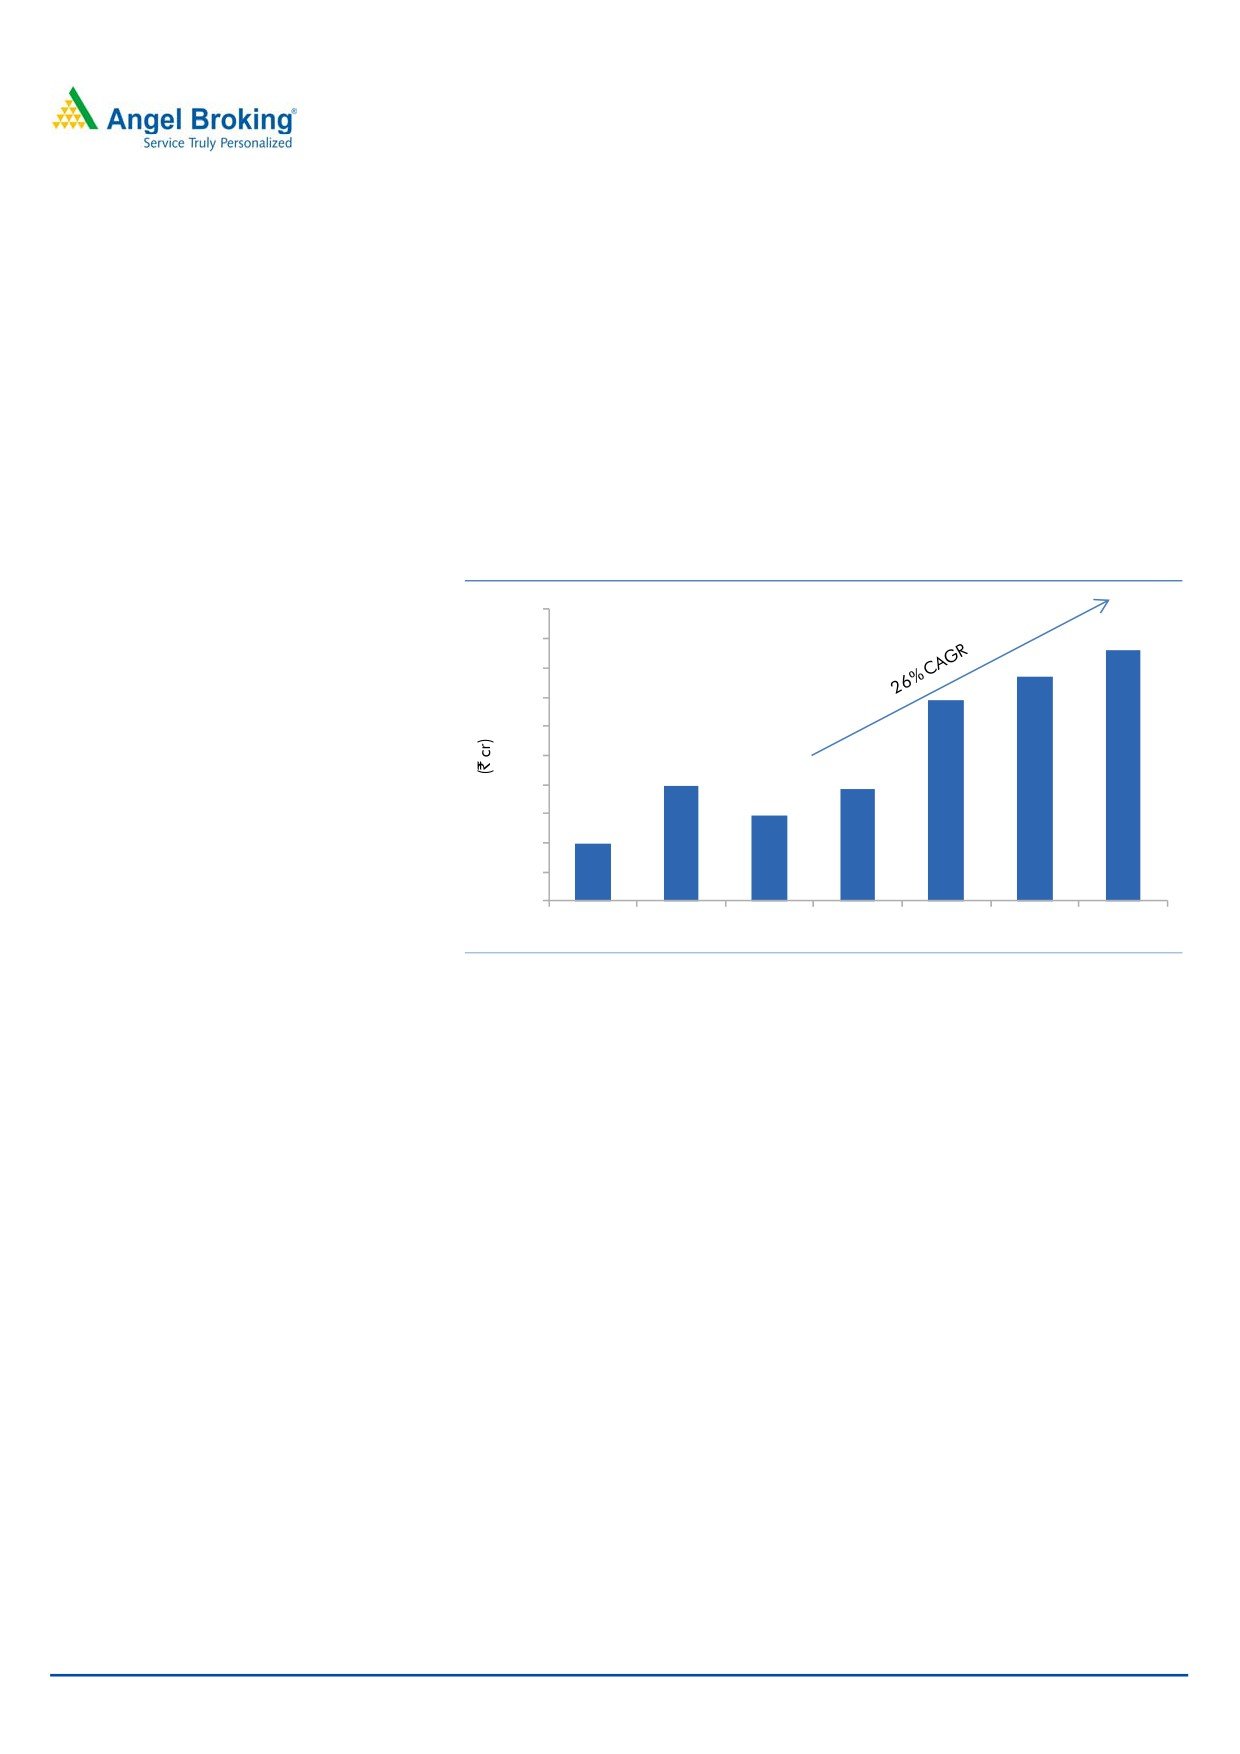
Higher export growth to drive overall revenue
KEI exports its wide range of cables i.e. EHV (66kV to 220kV), MV (11kV to 66kV)
and LV (<11kV) to over 45 countries and operates in the export markets of UAE,
Singapore, Nigeria and Kazakhstan. It also has branch offices in Australia and
South Korea.
We are expecting the company to report a strong export CAGR of ~26% over
FY2016-19 on the back of order execution (current order book ~`150-180cr).
Further the company has participated in an international tender worth `500cr,
which is expected to add in order book. During 1HFY2017, the company has
already reported ~79% growth in revenue to `187cr.
Exhibit 6: Exports to report 26% CAGR
500
450
400
431
350
385
344
300
250
200
198
191
150
147
100
97
50
0
FY2013
FY2014
FY2015
FY2016
FY2017E FY2018E FY2019E
Source: Company, Angel Research
December 30, 2016
4
KEI Industries | Initiating Coverage
Increased focus on Retail business
KEI has kept strong focus on growing its B2C revenue which can be clearly seen in
its improved business mix. In FY13 B2C represented ~25% of its total sales which
increased to ~30% in FY16. This is mainly on back of strong distribution network
and higher ad spends. Management continues to target higher B2C sales and
expects it to reach to 40-45% level in the next 2-3 years.
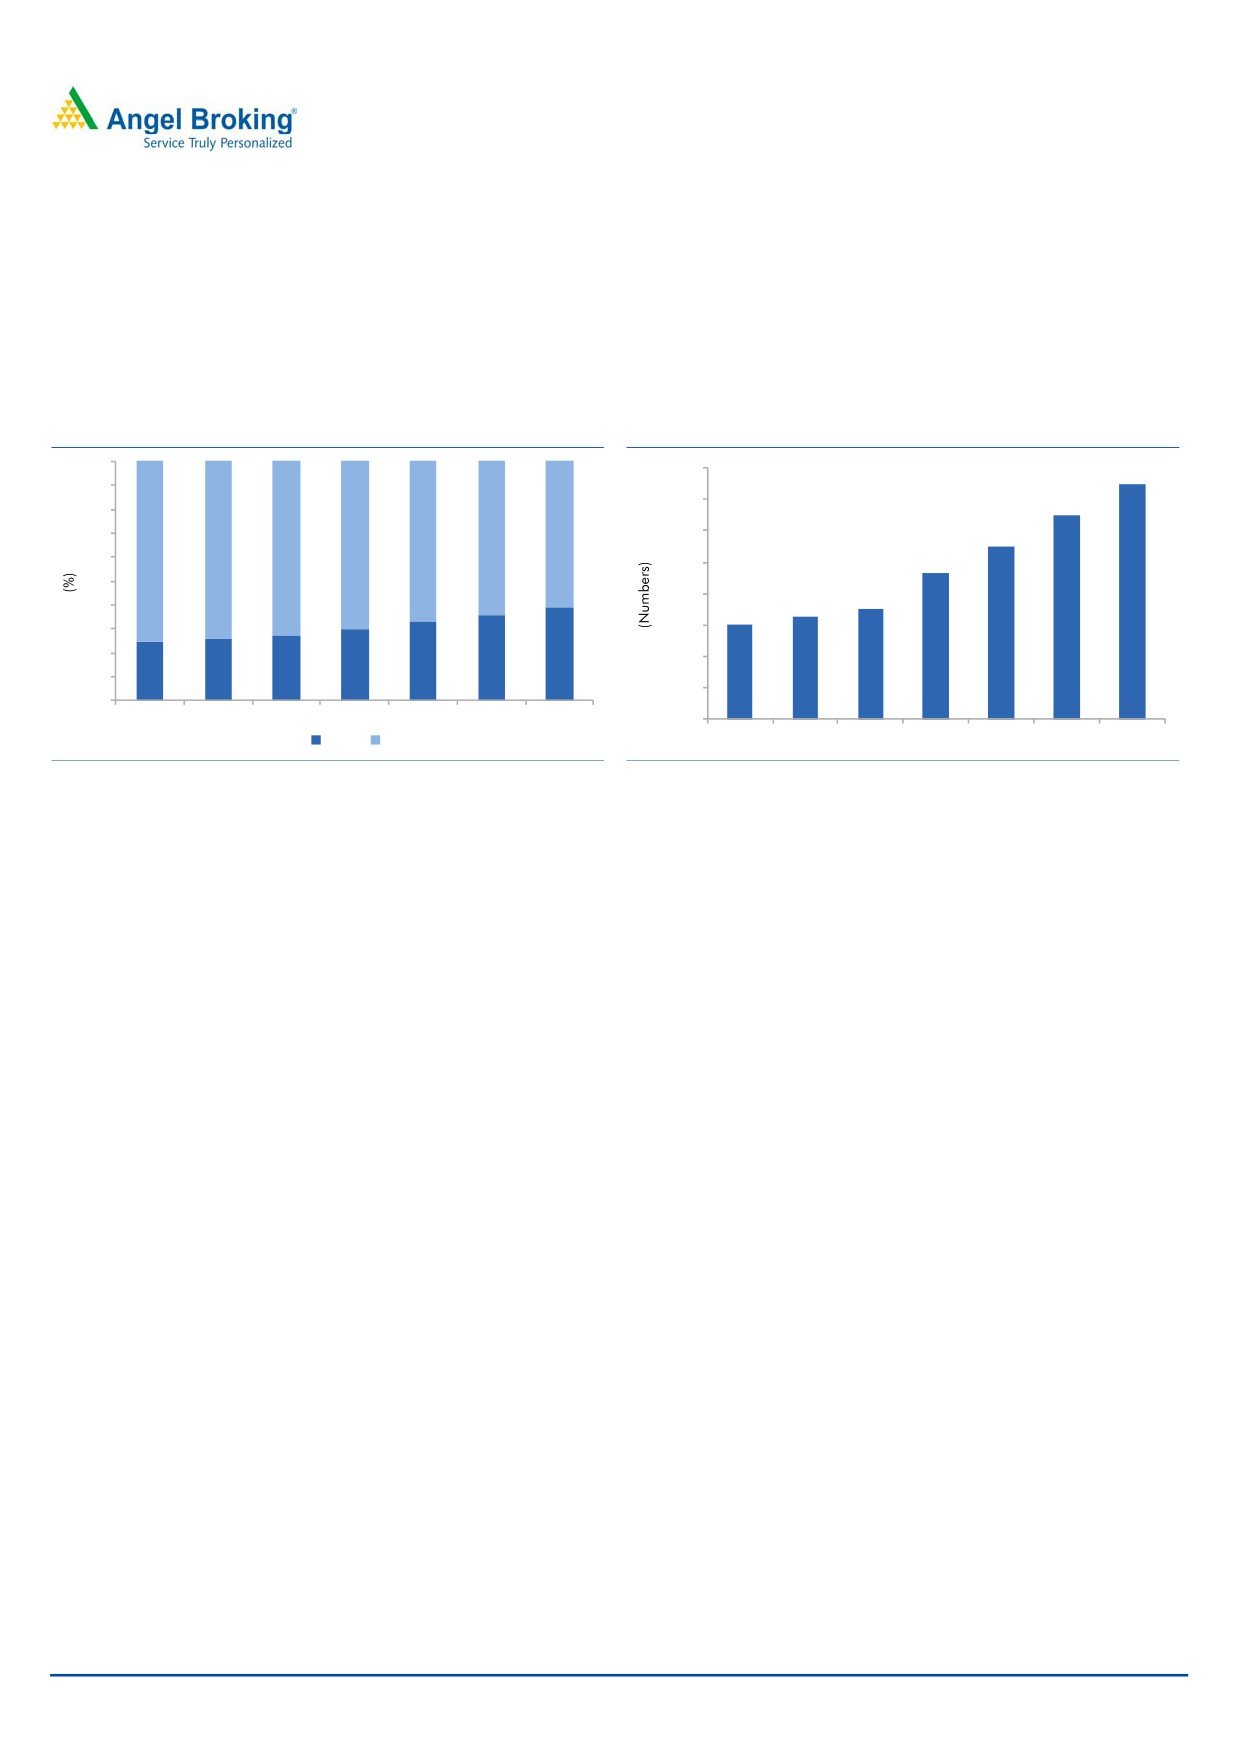
Exhibit 7: B2C vs B2B revenue mix
Exhibit 8: Enhancing dealer network
100
1,600
1,500
90
1,400
1,300
80
70
1,200
1,100
67
64
61
75
74
73
70
60
926
1,000
50
800
700
650
40
601
30
600
20
36
39
400
30
33
25
26
27
10
200
0
FY2013
FY2014
FY2015
FY2016
FY2017E
FY2018E FY2019E
0
B2B
B2C
FY2013
FY2014
FY2015
FY2016
FY2017E FY2018E FY2019E
Source: Company, Angel Research
Source: Company, Angel Research
Strengthening Distribution Network to boost retail growth
KEI is aggressively adding dealers and distributors across the country, especially in
tier 1 and tier 2 cities. It has increased its distribution channels from 601 in
FY2013 to 926 in FY2016 and is further planning to add 150-200 dealers every
year going forward. Owing to this, company has seen strong traction in its B2C
revenue.
Higher ad spends to increase brand visibility
In order to increase B2C business, the company has increased their ad spends in
last four years which increased from `2cr in FY13 to `7cr in FY16. Further, the
company has also taken other initiatives such as sponsoring IPL team - Kings XI
Punjab, association with regional exhibitions held by reputable bodies,
participation in international award events in the Middle East, South East Asia and
Europe, etc.
December 30, 2016
5
KEI Industries | Initiating Coverage
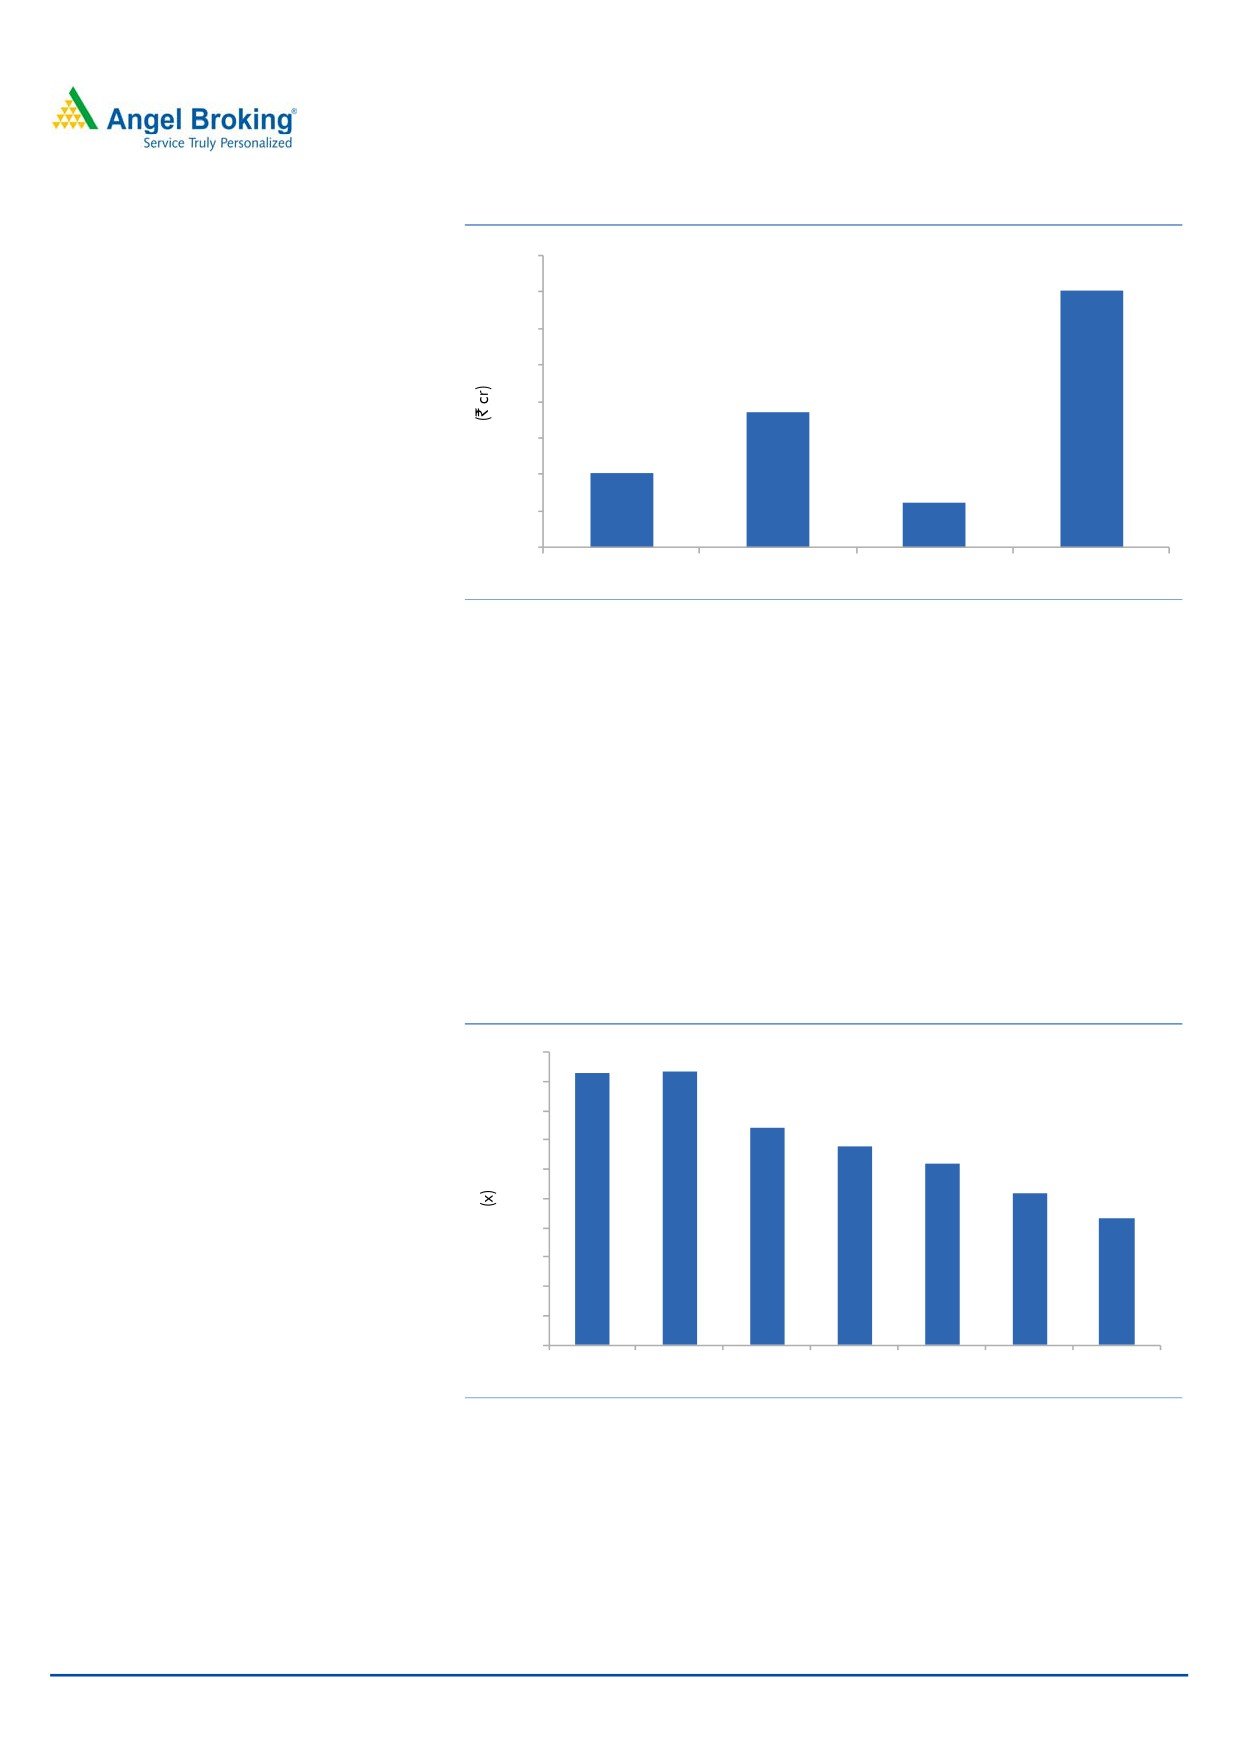
Exhibit 9: Significant increase in ad spend
8.0
7.0
7.0
6.0
5.0
3.7
4.0
3.0
2.0
2.0
1.2
1.0
0.0
FY2013
FY2014
FY2015
FY2016
Source: Company, Angel Research
Interest cost as a % of sale to decline 150bp over FY16-19
In 1HFY17, the company had total debt of `617cr of which `211cr was in form of
term loan. Management has indicated that it will fully repay the term loan in next
three years; we however have assumed `90cr repayment of term loan in our
forecast. This however would be offset by the incremental working capital loan due
to the growth in its EPC. The company however has seen improvement in its credit
rating which means company would be able to raise working capital loan at
competitive rate. The effect in our opinion would be drop in its interest cost as % to
net sales as rise in working capital loan would be offset by lower interest rate and
repayment of term loan. This would lead to improving profitability.
Exhibit 10: Debt/Equity ratio falling
2.0
1.9
1.9
1.8
1.6
1.5
1.4
1.4
1.2
1.2
1.0
1.0
0.9
0.8
0.6
0.4
0.2
0.0
FY2013
FY2014
FY2015
FY2016
FY2017E FY2018E FY2019E
Source: Company, Angel Research
December 30, 2016
6
KEI Industries | Initiating Coverage
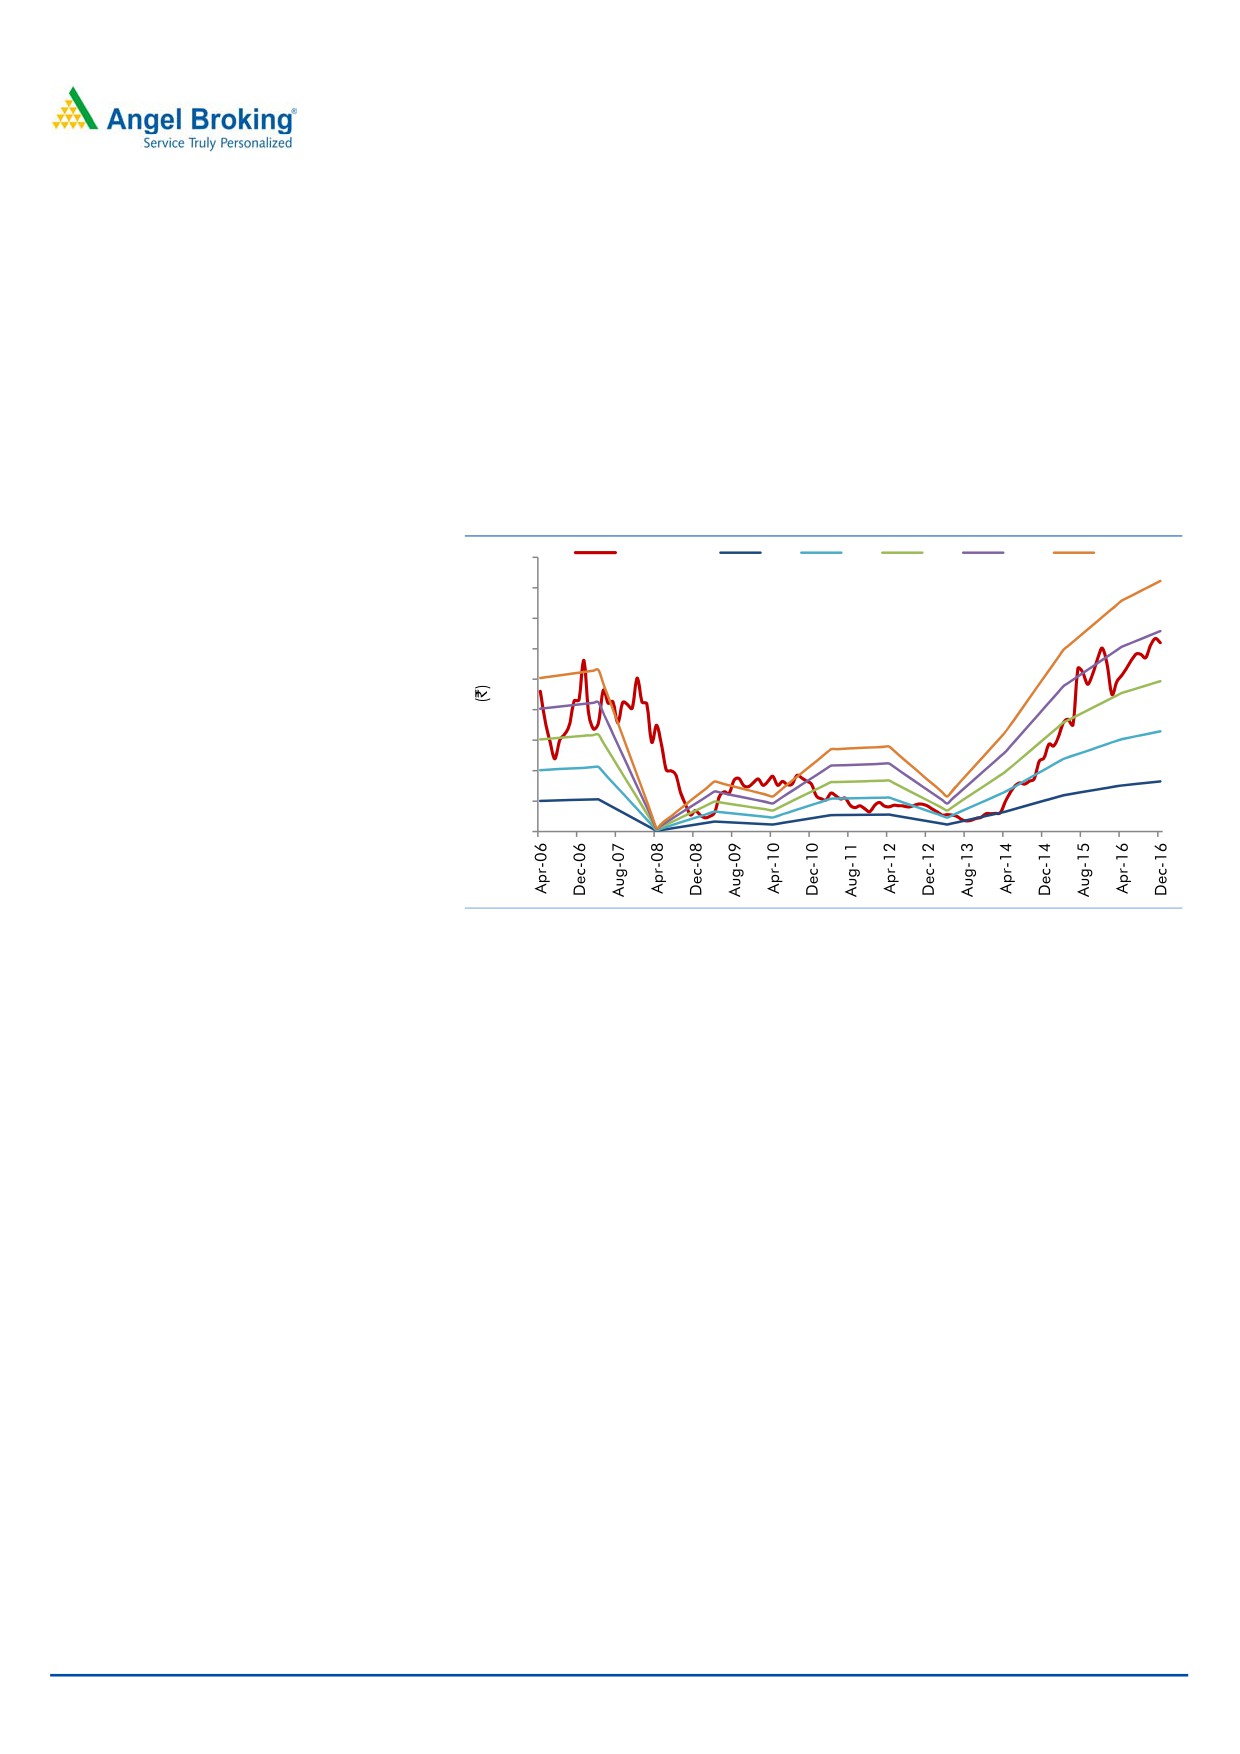
Outlook and Valuation
We expect KEI to report net revenue CAGR of
~13% to ~`3,335cr over
FY2016-19E mainly due to (a) higher order book execution in EPC segment
(b) growth in EHV business and (c) higher B2C sales and (d) higher exports. On the
bottom-line front, we expect a CAGR of ~24% to `118cr over the same period on
the back strong revenue and lower interest cost. At the CMP of `124, the stock
trades at 8.1x its FY2019E EPS of `15.3. We initiate coverage on the stock with a
Buy recommendation and target price of `153 based on 10x FY2019E EPS,
indicating an upside of ~23% from the current levels.
Exhibit 11: One year forward PE Chart
180
Share Price
3x
6x
9x
12x
15x
160
140
120
100
80
60
40
20
0
Source: Company, Angel Research
Downside risks to our estimates
KEI’s EPC segment contributes ~14% in the total revenue. This segment
primarily depends upon government spending and any delay in investment by
government may lead to reduction in order book and would impact its
revenue.
Any unfavourable change in the prices of commodities, forex and interest
rates, and delay in project execution can hurt its profitability.
December 30, 2016
7
KEI Industries | Initiating Coverage
Company Background
KEI Industries Limited (KEI) is a cable manufacturing company, engaged in
manufacture and supply of power and other industrial cables. The Company is
also engaged in Engineering, Procurement and Construction (EPC) business. It
operates through Cables and Turnkey Projects segments and has its manufacturing
facilities at Bhiwadi & Chopanki in Rajastahn and Silvassa in Dadra and Nagar
Haveli.
The cables segment comprises of a whole range of cables such as Extra High
Voltage (EHV), High tension (HT) and low tension (LT) power cables, control and
instrumentation cables, winding wires, flexible wires, and house and stainless steel
wires. Their products are supplied in various sectors like oil refineries, railways,
automobiles, cement, steel, fertilizers, textile and real estate sectors.
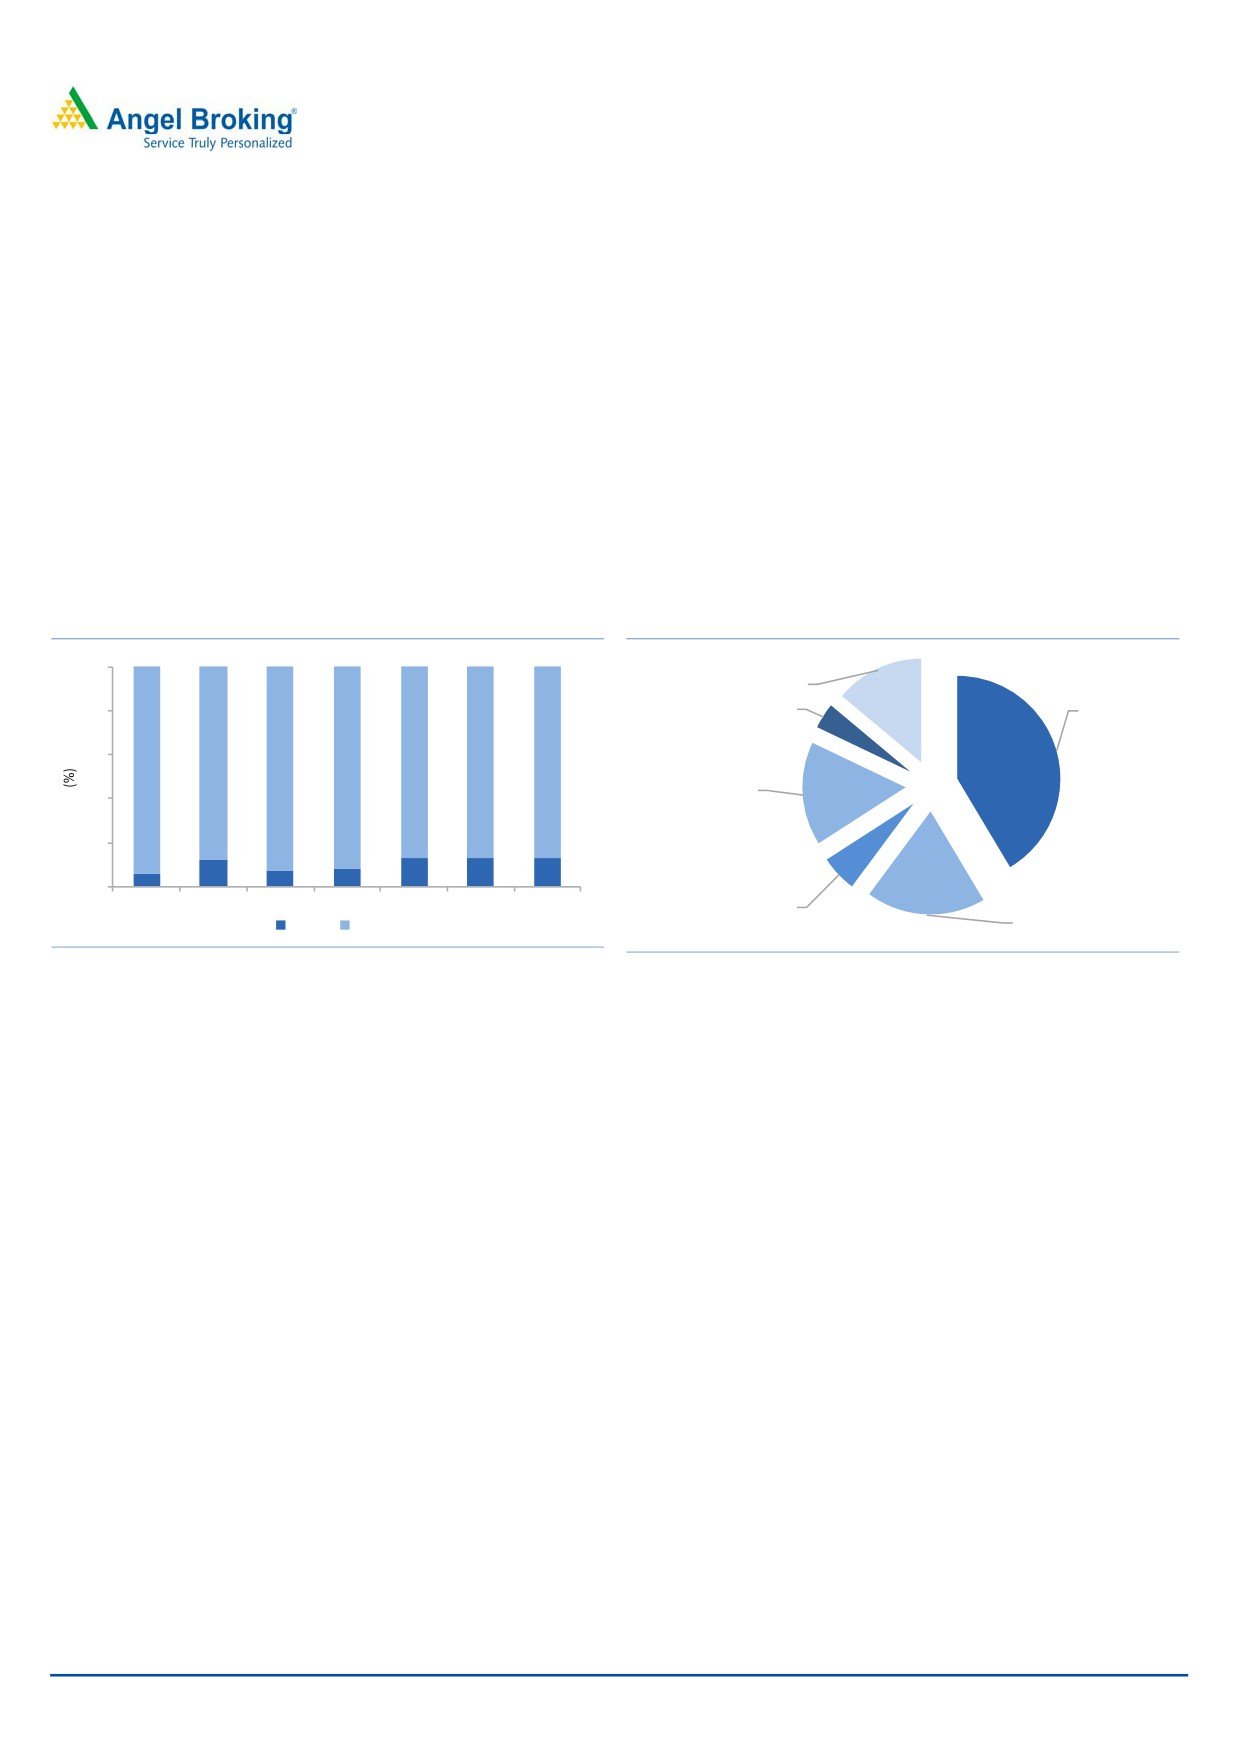
Exhibit 12: Revenue-break (Domestic vs Export)
Exhibit 13: Revenue -break up for FY2016
Turnkey
100
Projects, 14%
LT Power /
Stainless Steel
Rubber cable,
80
Wire, 4%
41%
60
88
87
87
87
94
93
92
HW, WW &
40
Flexible wire,
16%
20
12
13
13
13
6
7
8
0
EHV cable, 6%
HT Power
FY2013
FY2014
FY2015
FY2016
FY2017E FY2018E FY2019E
casble, 19%
Export
Domestic
Source: Company, Angel Research
Source: Company, Angel Research
December 30, 2016
8
KEI Industries | Initiating Coverage
Profit & Loss Statement
Y/E March (` cr)
FY2015
FY2016
FY2017E
FY2018E
FY2019E
Total operating income
2,031
2,326
2,574
2,921
3,335
% chg
25.5
14.5
10.7
13.5
14.2
Total Expenditure
1,838
2,083
2,306
2,629
3,001
Raw Material
1,477
1,615
1,796
2,051
2,354
Personnel
62
83
98
117
140
Others Expenses
299
386
412
462
507
EBITDA
193
242
268
292
333
% chg
26.0
25.6
10.5
9.1
14.2
(% of Net Sales)
9.5
10.4
10.4
10.0
10.0
Depreciation& Amortisation
25
25
29
30
32
EBIT
168
217
239
262
302
% chg
27.4
28.9
10.1
9.6
15.3
(% of Net Sales)
8.3
9.3
9.3
9.0
9.1
Interest & other Charges
120
127
128
131
132
Other Income
5
5
6
6
6
(% of PBT)
9.4
5.6
4.7
4.0
3.1
Share in profit of Associates
-
-
-
-
-
Recurring PBT
53
95
116
136
176
% chg
142.3
80.3
22.1
17.1
29.0
Tax
19
33
38
45
58
(% of PBT)
35.2
34.8
33.0
33.0
33.0
PAT (reported)
34
62
78
91
118
Extraordinary Items
2
-
-
-
-
ADJ. PAT
33
62
78
91
118
% chg
180.7
91.0
25.4
17.1
29.0
(% of Net Sales)
1.6
2.7
3.0
3.1
3.5
Basic EPS (`)
4.2
8.1
10.1
11.8
15.3
Fully Diluted EPS (`)
4.2
8.1
10.1
11.8
15.3
% chg
180.7
91.0
25.4
17.1
29.0
December 30, 2016
9
KEI Industries | Initiating Coverage
Balance Sheet
Y/E March (` cr)
FY2015
FY2016
FY2017E FY2018E FY2019E
SOURCES OF FUNDS
Equity Share Capital
15
15
15
15
15
Reserves& Surplus
288
351
424
509
618
Shareholders Funds
304
367
440
525
633
Minority Interest
-
-
-
-
-
Total Loans
453
498
547
545
552
Deferred Tax Liability
39
40
40
40
40
Total Liabilities
796
905
1,027
1,110
1,225
APPLICATION OF FUNDS
Gross Block
445
500
544
559
589
Less: Acc. Depreciation
147
172
200
231
262
Net Block
298
328
344
328
327
Capital Work-in-Progress
4
29
-
-
-
Investments
3
3
3
3
3
Current Assets
1,036
1,127
1,280
1,481
1,708
Inventories
440
422
479
552
640
Sundry Debtors
480
567
635
736
850
Cash
5
6
12
17
19
Loans & Advances
106
109
129
146
167
Other Assets
5
22
26
29
33
Current liabilities
562
586
604
706
817
Net Current Assets
474
541
677
774
891
Deferred Tax Asset
16
4
4
4
4
Mis. Exp. not written off
-
-
-
-
-
Total Assets
796
905
1,027
1,110
1,225
December 30, 2016
10
KEI Industries | Initiating Coverage
Cash flow Statement
Y/E March (` cr)
FY2015
FY2016
FY2017E FY2018E FY2019E
Profit before tax
53
95
116
136
176
Depreciation
25
25
29
30
32
Change in Working Capital
5
(51)
(130)
(93)
(115)
Interest / Dividend (Net)
120
127
128
131
132
Direct taxes paid
(9)
(20)
(38)
(45)
(58)
Others
5
8
0
0
0
Cash Flow from Operations
198
185
105
160
166
(Inc.)/ Dec. in Fixed Assets
(17)
(98)
(44)
(15)
(30)
(Inc.)/ Dec. in Investments
0
0
29
0
0
Cash Flow from Investing
(17)
(98)
(15)
(15)
(30)
Issue of Equity
0
0
0
0
0
Inc./(Dec.) in loans
44
92
49
(2)
7
Dividend Paid (Incl. Tax)
(2)
(3)
(5)
(6)
(9)
Interest / Dividend (Net)
(224)
(175)
(128)
(131)
(132)
Cash Flow from Financing
(181)
(87)
(84)
(140)
(134)
Inc./(Dec.) in Cash
0
1
6
5
2
Opening Cash balances
5
5
6
12
17
Closing Cash balances
5
6
12
17
19
December 30, 2016
11
KEI Industries | Initiating Coverage
Key ratios
Y/E March
FY2015
FY2016
FY2017E FY2018E FY2019E
Valuation Ratio (x)
P/E (on FDEPS)
29.4
15.4
12.3
10.5
8.1
P/CEPS
16.3
10.9
9.0
7.9
6.4
P/BV
3.2
2.6
2.2
1.8
1.5
Dividend yield (%)
0.3
0.4
0.5
0.7
1.0
EV/Sales
0.7
0.6
0.6
0.5
0.4
EV/EBITDA
7.3
6.0
5.6
5.1
4.5
EV / Total Assets
1.8
1.6
1.5
1.3
1.2
Per Share Data (`)
EPS (Basic)
4.2
8.1
10.1
11.8
15.3
EPS (fully diluted)
4.2
8.1
10.1
11.8
15.3
Cash EPS
7.6
11.3
13.8
15.7
19.3
DPS
0.4
0.5
0.6
0.8
1.2
Book Value
39.3
47.5
56.9
67.9
82.0
Returns (%)
ROCE
22.2
25.1
24.2
24.5
25.5
Angel ROIC (Pre-tax)
22.5
25.4
24.6
24.9
26.0
ROE
10.7
17.0
17.7
17.4
18.6
Turnover ratios (x)
Asset Turnover (Gross Block)
4.6
4.7
4.7
5.2
5.7
Inventory / Sales (days)
79
66
68
69
70
Receivables (days)
86
89
90
92
93
Payables (days)
40
41
41
41
41
WC cycle (ex-cash) (days)
126
115
117
120
122
December 30, 2016
12
KEI Industries | Initiating Coverage
Research Team Tel: 022 - 39357800
DISCLAIMER
Angel Broking Private Limited (hereinafter referred to as “Angel”) is a registered Member of National Stock Exchange of India Limited,
Bombay Stock Exchange Limited and Metropolitan Stock Exchange Limited. It is also registered as a Depository Participant with CDSL
and Portfolio Manager with SEBI. It also has registration with AMFI as a Mutual Fund Distributor. Angel Broking Private Limited is a
registered entity with SEBI for Research Analyst in terms of SEBI (Research Analyst) Regulations, 2014 vide registration number
INH000000164. Angel or its associates has not been debarred/ suspended by SEBI or any other regulatory authority for accessing
/dealing in securities Market. Angel or its associates/analyst has not received any compensation / managed or co-managed public
offering of securities of the company covered by Analyst during the past twelve months.
This document is solely for the personal information of the recipient, and must not be singularly used as the basis of any investment
decision. Nothing in this document should be construed as investment or financial advice. Each recipient of this document should
make such investigations as they deem necessary to arrive at an independent evaluation of an investment in the securities of the
companies referred to in this document (including the merits and risks involved), and should consult their own advisors to determine
the merits and risks of such an investment.
Reports based on technical and derivative analysis center on studying charts of a stock's price movement, outstanding positions and
trading volume, as opposed to focusing on a company's fundamentals and, as such, may not match with a report on a company's
fundamentals. Investors are advised to refer the Fundamental and Technical Research Reports available on our website to evaluate the
contrary view, if any.
The information in this document has been printed on the basis of publicly available information, internal data and other reliable
sources believed to be true, but we do not represent that it is accurate or complete and it should not be relied on as such, as this
document is for general guidance only. Angel Broking Pvt. Limited or any of its affiliates/ group companies shall not be in any way
responsible for any loss or damage that may arise to any person from any inadvertent error in the information contained in this report.
Angel Broking Pvt. Limited has not independently verified all the information contained within this document. Accordingly, we cannot
testify, nor make any representation or warranty, express or implied, to the accuracy, contents or data contained within this document.
While Angel Broking Pvt. Limited endeavors to update on a reasonable basis the information discussed in this material, there may be
regulatory, compliance, or other reasons that prevent us from doing so.
This document is being supplied to you solely for your information, and its contents, information or data may not be reproduced,
redistributed or passed on, directly or indirectly.
Neither Angel Broking Pvt. Limited, nor its directors, employees or affiliates shall be liable for any loss or damage that may arise from
or in connection with the use of this information.
Disclosure of Interest Statement
KEI Industries
1. Financial interest of research analyst or Angel or his Associate or his relative
No
2. Ownership of 1% or more of the stock by research analyst or Angel or associates or relatives
No
3. Served as an officer, director or employee of the company covered under Research
No
4. Broking relationship with company covered under Research
No
Ratings (Based on expected returns
Buy (> 15%)
Accumulate (5% to 15%)
Neutral (-5 to 5%)
over 12 months investment period):
Reduce (-5% to -15%)
Sell (< -15)
December 30, 2016
13